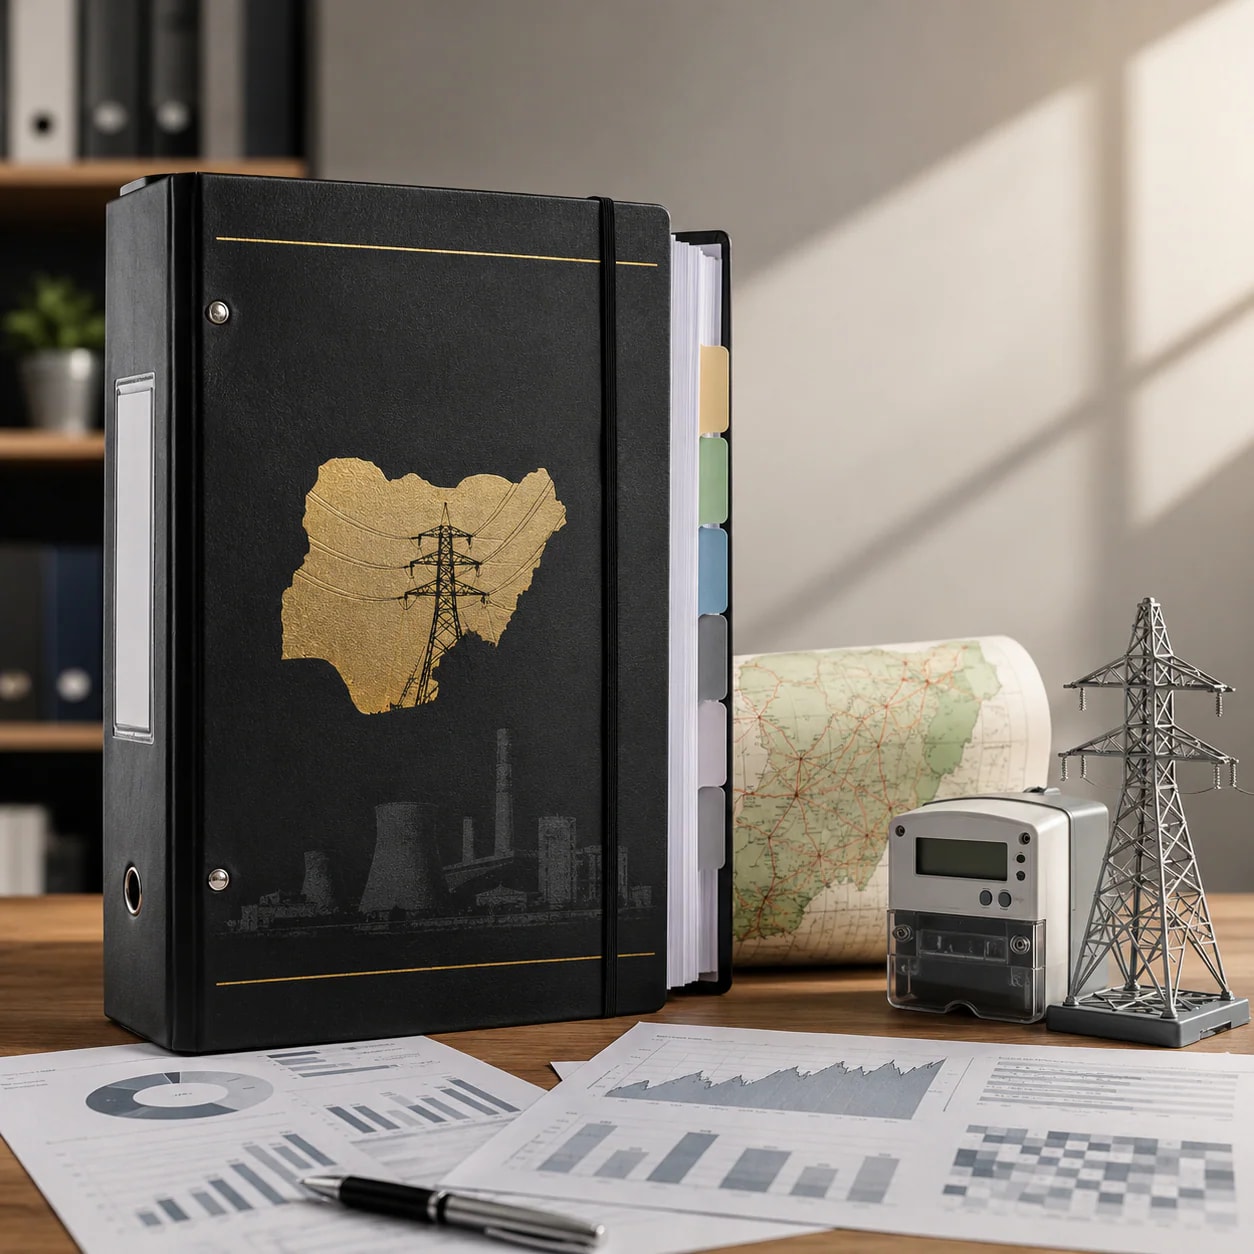
A source-led reference for locating and interpreting Nigerian electricity data on institutions, access, demand, generation, capacity, tariffs, metering and distribution losses—without treating figures from different periods as directly comparable.
Purpose, scope and evidence limitations
Electricity-Sector Research Document 116 is a reference guide, not evidence of a current search trend or breaking development. It organizes the supplied information about Nigeria’s electricity sector while preserving the distinctions between indicators and reporting periods.
The figures cannot be combined into a single snapshot. The materials cover electricity access and demand in 2022, production by source in 2023, tariffs and distribution losses in 2024, metering as of December 2024, and losses in the first quarter of 2025. The grid-capacity excerpt does not provide a date in the supplied material.
Several figures come from secondary sources. Statista notes that update cycles vary and its information may be incomplete. The Conversation’s regulatory and operational figures should be checked against the underlying NERC or other institutional records. Wikipedia is collaboratively edited, so its capacity figures should also be treated as provisional until confirmed in dated primary data.
Where to find official Nigerian electricity data and reports
Two official starting points in the supplied research package are the Energy Commission of Nigeria and the Nigerian Electricity Regulatory Commission.
The Energy Commission of Nigeria says it was established under Act No. 62 of 1979, as amended in 1988 and 1989, and began operating in 1989. It describes itself as the apex government organization responsible for overall energy-sector planning and policy implementation. Its website includes energy statistics, an energy data bank, policies, plans, laws, reports, papers, journals and bulletins. These categories make the commission a relevant source for national planning documents and broader energy reference material.
NERC’s website provides quarterly and annual reports as well as operational-data infographics. These resources are the appropriate place to seek dated regulatory and market records before relying on figures reproduced by secondary publishers. NERC also reports that 16 states have transitioned to state electricity regulation, a development that makes regulatory scope important when interpreting future records.
Researchers should record whether an official document covers the national market, a state-regulated market, a distribution company or another defined segment. They should also retain the report title and reporting period so later comparisons can be traced to the original publication.
How to distinguish access, demand, capacity and generation
Electricity access, demand, installed capacity and generation describe different parts of the sector.
Access measures the share of people with electricity access. Statista reports that just over 60% of Nigerians had access in 2022. This is a population measure; it does not show how many hours of service connected consumers received or how much electricity power plants produced.
Demand is an energy quantity associated with consumption requirements over a period. Statista places Nigerian electricity demand at 32.1 TWh in 2022. That figure should not be compared as though it were equivalent to capacity, which is measured in megawatts rather than terawatt-hours.
Generation or production measures electricity produced over time and can be separated by source. For 2023, Statista reports that approximately 32 TWh came from gas and just over 8 TWh from hydropower. These production figures belong to a different year from the reported 2022 demand figure.
Capacity describes the rated scale of generation assets, not their actual output during a year. The supplied Wikipedia excerpt reports 23 grid-connected generating plants with a combined capacity of 11,165.4 MW. It attributes 86% of capacity to gas and the remainder to hydropower. Because that excerpt is collaboratively edited and undated in the research package, the figure should be verified against a dated primary record before quotation.
A sound comparison therefore keeps the unit, definition and reference period attached to every number. TWh of annual demand, TWh of production, MW of capacity and a population-access percentage cannot be substituted for one another.
Electricity access and reliance on backup generators
The supplied 2022 access figure indicates a substantial national access gap: Statista reports that just over 60% of Nigerians had electricity access that year. Access alone, however, does not describe service reliability for people who are connected.
The Wikipedia excerpt associates chronic grid shortages with the use of generators by households and businesses. Separately, The Conversation cites a World Bank estimate of more than 22 million diesel and gasoline generators powering about 26% of Nigerian households. Both are secondary accounts and should be attributed as such rather than presented as direct findings from a primary dataset.
These indicators answer different questions. The access percentage concerns whether people have electricity access, while the generator estimate concerns backup or alternative power use among households. Neither figure, on its own, establishes the frequency or duration of outages. Researchers examining the relationship between access and reliability should therefore avoid treating connection to electricity as proof of continuous grid service and should trace the generator estimate to its underlying World Bank material before reuse.
Band A tariffs and service classification
The Conversation reports that the Band A electricity tariff increased in April 2024 from ₦67 to ₦225 per kWh. It describes Band A as covering feeders receiving at least 20 hours of electricity supply per day.
The price and the service threshold should be recorded together. The tariff is a charge per unit of electricity, while the 20-hour threshold describes the reported service classification. Neither should be interpreted as a national measure of electricity access, generation or installed capacity.
Because these details are supplied through secondary analysis, anyone quoting them in policy, financial or consumer reporting should confirm the applicable date, scope and wording in the underlying regulatory records. A later tariff document or a record applying to a different customer category or jurisdiction should not be assumed to describe the same conditions.
Metering coverage and consumer billing exposure
The Conversation reports that, as of December 2024, 6.29 million of 13.5 million registered customers across 12 distribution companies were metered. It gives a metering rate of 46.57%.
The reported counts refer to registered customers and metered customers within the stated distribution-company scope at a specific point in time. They should not be recast as population-access figures, and they should not be compared with generation or capacity data.
The reported coverage also means that more than half of registered customers in that dataset were not metered. The supplied research links incomplete metering with exposure to estimated billing and billing disputes. For consumer or policy analysis, the customer total, meter count, reported percentage, number of distribution companies and December 2024 reference date should remain attached to the claim.
The figures come from secondary analysis, so the underlying NERC records should be consulted before the numbers are used as primary evidence or compared with a later reporting period.
Distribution losses, regulatory targets and sector finances
The supplied loss figures cover separate quarters and must be labeled accordingly. The Conversation reports aggregate distribution-company losses of 36.36% in the first quarter of 2024 and 39.10% in the third quarter of 2024.
For the first quarter of 2025, it reports aggregate technical and commercial losses of 39.6%. That result is compared with a 20.5% target under the regulatory framework. The same source associates the gap with an estimated ₦200.5 billion in forgone revenue for the quarter.
These figures should not be presented as one continuous annual series without checking whether the definitions, scope and reporting method are consistent. In particular, the supplied wording for 2024 refers to aggregate distribution-company losses, while the first-quarter 2025 figure is described as aggregate technical and commercial losses. The reporting periods also differ.
The research package links high technical, commercial and collection losses with weaker sector finances and pressure on revenue recovery, tariffs and public subsidies. The reported ₦200.5 billion is an estimated quarterly revenue implication rather than a generation, demand or customer-billing measure.
Before using the figures for trend analysis, researchers should locate the corresponding NERC records, confirm the loss definition used in each quarter, verify the regulatory target and preserve any qualifications attached to the revenue estimate.
A practical method for comparing Nigeria’s electricity statistics
A reusable comparison record should capture six elements for every figure:
1. Indicator definition: Specify whether the number concerns access, demand, production, installed capacity, metering, tariffs or losses. 2. Unit: Preserve percentages, TWh, MW, ₦/kWh, customer counts and monetary estimates exactly as distinct units. 3. Reference period: Record the year, quarter or point-in-time date. Do not merge 2022 demand and access, 2023 production, December 2024 metering and first-quarter 2025 losses into one current-period profile. 4. Scope: Note whether the figure covers people, registered customers, grid-connected plants, 12 distribution companies, a service band or the wider national sector. 5. Source type: Distinguish official institutional records from secondary analysis and collaboratively edited material. 6. Verification status: Record whether the figure has been checked against a dated primary report and whether the publisher warns of incomplete information or variable update cycles.
This method prevents a capacity figure in MW from being read as actual energy production in TWh, or an access percentage from being interpreted as a measure of supply duration. It also exposes gaps that need resolution before publication, including undated figures and secondary claims without their underlying tables or regulatory documents.
Verification priorities and recommended source hierarchy
Begin verification with dated official records. The Energy Commission of Nigeria provides planning, policy, statistics and data resources, while NERC provides quarterly and annual reports and operational-data infographics. These portals should be checked for the original reporting period, indicator definition and market scope.
Next, trace figures reported by Statista and The Conversation to their underlying tables, regulatory publications or institutional reports. Preserve the attribution if the primary document cannot be located. Statista’s variable update cycles and possible incompleteness are reasons to avoid presenting its excerpts as definitive current data. The Conversation’s tariff, metering, loss and generator claims likewise require confirmation in the underlying NERC or World Bank materials.
Treat the supplied Wikipedia capacity and generation-mix excerpt as provisional until it can be matched to a dated primary record. Its figures may be useful for identifying what to verify, but its collaborative format and missing date limit direct comparison with the dated indicators elsewhere in this guide.
Before quoting, comparing or applying any figure, use the cited official report portals to verify it against a dated primary record.
Disclosures and limitations
– This article was prepared with AI assistance from an approved content plan and the supplied research package. – The article relies on supplied material attributed to the Energy Commission of Nigeria, NERC, Statista, Wikipedia and The Conversation. Secondary and undated figures should be verified against dated primary records before use. – No product data or recommendations were supplied, and this article contains no affiliate links or product endorsements.
Sources
– Electricity sector in Nigeria – Wikipedia — en.wikipedia.org – Situation Nigeria Situation — data.unhcr.org – Future Forces Forum — future-forces-forum.org – Topic: Energy sector in Nigeria — Statista – Global Participant Directory – World Movement for Democracy — World Movement for Democracy – Nigeria raised electricity prices to improve supply. Why it hasn’t worked — The Conversation – Energy Commission of Nigeria — energy.gov.ng – NIGERIAN ELECTRICITY REGULATORY COMMISSION — nerc.gov.ng – EUR-Lex – 52026DC0538 – EN – EUR-Lex — eur-lex.europa.eu – Nigeria Energy Situation – energypedia — energypedia.info