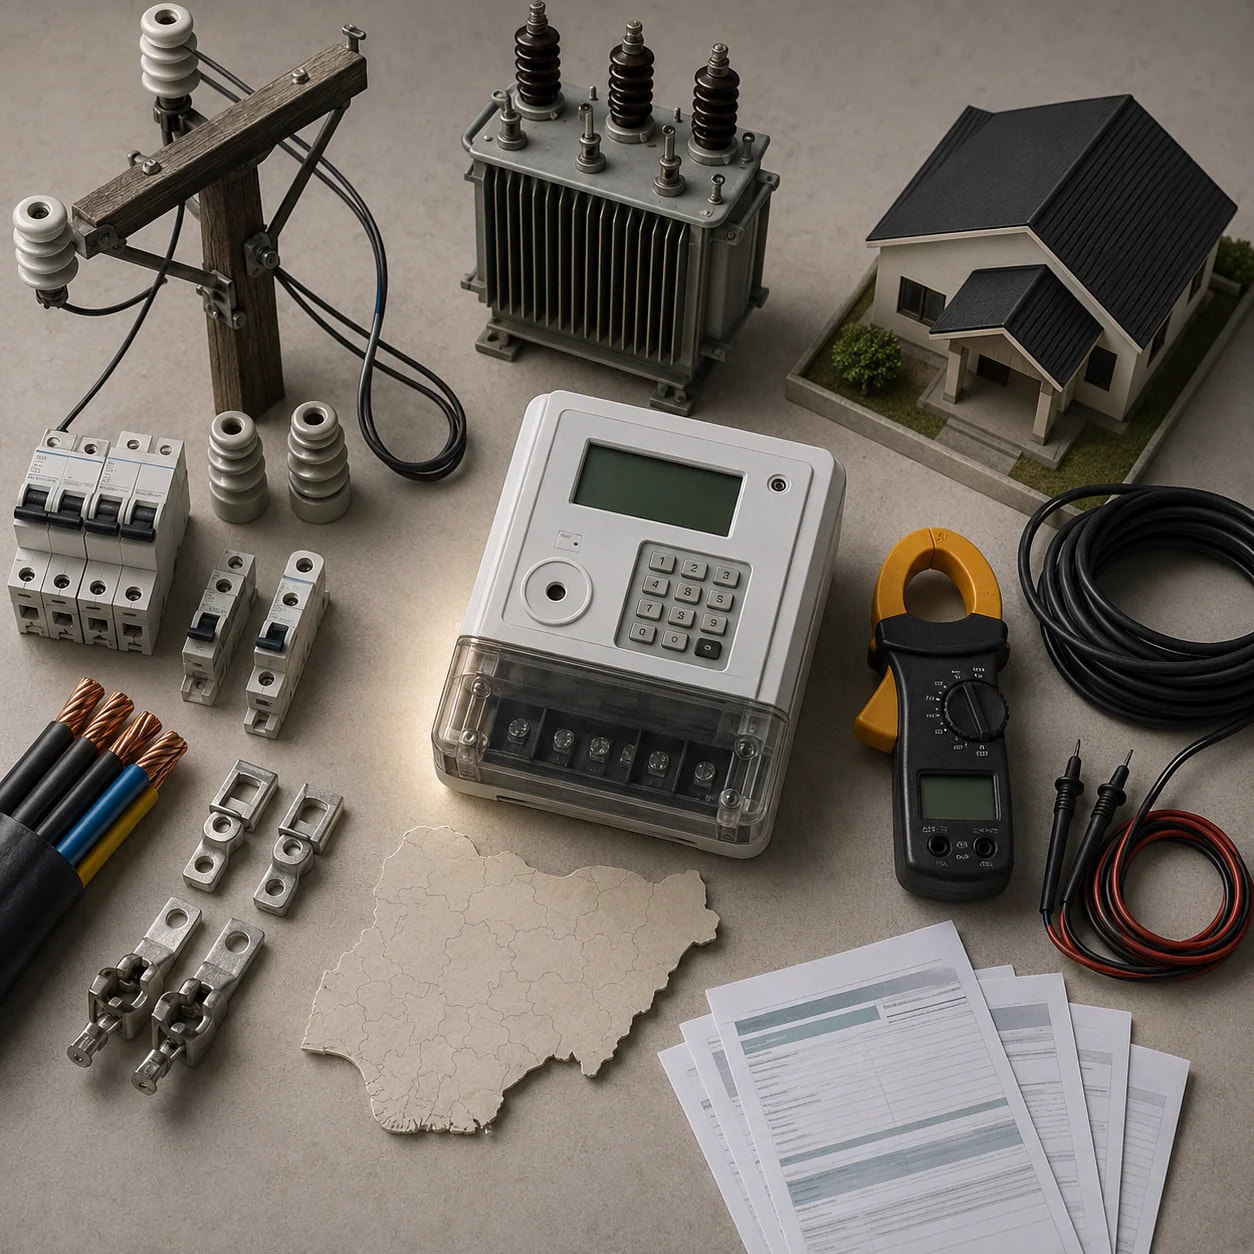
A source-led explanation of how feeder bands, meter coverage, network losses and proposed distribution improvements affect electricity consumers in Nigeria.
What Nigeria’s electricity distribution networks do
Nigeria’s electricity distribution networks are where electricity service becomes visible to consumers through local supply, metering and billing. Their performance depends on more than physical assets: commercial operations, revenue collection, management systems and transparency also influence how effectively electricity is delivered and accounted for.
The condition of distribution assets matters because faults, overloaded or inactive infrastructure can contribute to unreliable service. Commercial weaknesses—including unmetered consumption, electricity theft and unpaid bills—can also reduce the revenue available to sustain operations.
These linked problems explain why one Energy for Growth Hub recommendation calls for an inventory and audit of electricity assets across the generation, transmission and distribution value chain. The proposed purpose is to identify priorities for investment, repair and replacement. The recommendation should be understood as a policy proposal rather than evidence that a nationwide audit or upgrade has been completed.
How feeder bands relate to expected supply hours
Nigeria’s electricity regulator classifies consumers into five service bands—A through E—according to the daily supply hours associated with their local distribution feeder. The Conversation reports that Band A represents at least 20 hours of electricity supply per day, while Band E represents four to seven hours per day.
A consumer’s feeder is therefore important when interpreting the service level attached to an account or location. People served by different feeders can have substantially different stated supply expectations, even when they are customers of the same distribution company.
The band classification is a service reference, but consumers should compare it with their actual supply pattern. Recording the hours when electricity is available can help them assess whether observed service broadly corresponds with the band shown in their distribution company’s records. Because the supplied research does not provide the hour ranges for Bands B, C or D, those ranges are not stated here. Current band assignments and applicable supply expectations should be checked with the relevant distribution company or regulator.
The metering gap and its effect on consumer billing
Meter coverage remains a central consumer issue. The Conversation reported that, as of December 2024, 6.29 million of the 13.5 million registered customers across 12 distribution companies had meters. That represented a metering rate of 46.57%, meaning more than half of the reported registered-customer base was not metered at that point.
A meter provides a basis for connecting a bill to recorded electricity use. Where customers remain unmetered, accurate usage-based billing becomes more difficult and disputes over estimated bills are more likely. Consumers should therefore distinguish between having a registered account and having an installed, recognized meter attached to that account.
Metering can include different payment arrangements. Femade Group states that it develops customized metering systems for Nigerian distribution companies and supplies both prepaid and postpaid meters. This is a company’s own description of its offerings, not independent evidence about national deployment or performance.
For practical verification, consumers can check whether their meter details appear correctly in their distribution company’s records and compare those details with their bills. The reported national figures should also be checked against current regulatory or primary records before being treated as up to date.
Why distribution losses affect service and financial sustainability
Distribution companies face a combination of technical, commercial and collection losses. The Conversation reported that the combined level across all Nigerian distribution companies was 36.36% in the first quarter of 2024 and increased to 39.10% in the third quarter.
The supplied research associates these losses with several problems: infrastructure faults, electricity theft, unmetered consumption and unpaid bills. Together, they indicate that a significant share of electricity and expected revenue may not be successfully delivered, measured or collected within the distribution system.
The distinction between the contributing problems matters. Repairs and replacement may be relevant where physical infrastructure is faulty, while wider meter coverage can improve the measurement of consumption. Theft and non-payment present commercial and collection challenges. No single intervention described in the research package resolves every part of the combined loss figure.
High combined losses can weaken the financial sustainability of distribution companies. That can make network performance, metering and revenue collection mutually reinforcing concerns: weak infrastructure can affect service, while weak measurement and collection can constrain the commercial position of the company responsible for distribution. The quarterly percentages are attributed to secondary analysis and should be verified against the corresponding regulatory or primary reports before publication or policy use.
What distribution-network improvement can involve
Distribution-network improvement can include both physical and operational work. Energy for Growth Hub recommends an inventory and audit of electricity assets to identify priority investment, repair and replacement needs across the power value chain. Such an exercise could help distinguish assets that require maintenance from those that require replacement or new investment.
The organization also recommends that distribution companies invest in new information-technology systems to improve revenue collection, management and transparency. In this framing, network reform is not limited to lines and equipment. It also includes better information systems and the use of data analysis to understand operations and commercial performance.
These measures address different parts of the distribution challenge. Asset information can support decisions about physical work, while improved commercial and management information can support revenue administration and clearer records. The research package does not establish that these recommendations have been implemented across Nigeria or specify a completion timetable.
The source is undated in the supplied material, and some of its background information refers to older evidence. Its proposals are therefore presented here as recommendations, not as a description of current nationwide practice or a confirmed program of work.
How distributed energy can reuse or support local networks
Distributed energy can be combined with existing local distribution assets rather than requiring every project to start with an entirely new network. Atmosfair describes a planned project in Toto that would reactivate an existing distribution network that had been out of operation for more than two years.
According to the project description, the network would be connected to solar photovoltaic generation, battery storage and backup diesel-generation equipment. The project is intended to supply more than 2,000 users. It illustrates a proposed model in which local generation and storage support the reuse of dormant distribution infrastructure.
The example also shows that restoring local service can involve several connected tasks: addressing the condition of an existing network, adding generation, providing storage and retaining backup capacity. However, the supplied information does not establish the project’s completed status, actual service performance or consumer outcomes.
The claims come from the project organization’s own page and should be treated as attributed plans rather than independently verified results. Current implementation details would need confirmation from primary project or regulatory records.
What consumers should check about their electricity service
Consumers can use a small set of account and service details to assess their electricity supply and billing:
– Confirm whether the account is recorded as metered or unmetered and whether the meter details match the distribution company’s records. – Identify the feeder band assigned to the location and verify the current band information with the relevant distribution company or regulator. – Keep a record of actual daily supply hours and compare the observed pattern with the service level associated with the recorded band. – Review bills for consistency with the account’s meter status and retain previous bills or related distribution company records for comparison. – Confirm which distribution company and local feeder are responsible for the service location.
These checks do not by themselves resolve a billing or supply disagreement, and the research package does not provide a verified complaint procedure. They can, however, help consumers organize the relevant facts: meter status, feeder band, actual supply pattern, billing history and responsible distribution company. Current details should be verified directly with the relevant distribution company or regulator.
Evidence limits and verification notes
The figures on losses, meter coverage and feeder bands in this article come from The Conversation, a secondary analysis source. The underlying regulatory, distribution-company and other primary documents were not included in the research package. Key numbers should therefore be checked against current NERC or other relevant primary records before they are used for decisions.
The Energy for Growth Hub material supports policy recommendations about asset audits, information systems, revenue collection and transparency. Because no publication date was supplied and some background material may be older, those recommendations are not presented as current implementation.
Statements about the Toto project and Femade Group are attributed to the project organization and company respectively. They are self-reported descriptions, not independent verification of completion, performance or market coverage. No claim is made here about a Google Trends signal, rising search demand or a breaking-news event.
Disclosures and limitations
– This article was prepared with AI assistance from the supplied research package and approved content plan; no personal product use, testing or interviews are claimed. – Material claims are attributed to the supplied sources. The Conversation is a secondary source, while the Energy for Growth Hub, atmosfair and Femade Group materials include policy, project or company statements that may require confirmation against current primary records. – This article contains no product recommendation or disclosed affiliate offer. Readers should independently verify any future commercial links or recommendations for possible affiliate relationships.
Sources
– | Netdata — netdata.cloud – Five Electricity Policy Priorities for Nigeria – Energy for Growth Hub — Energy for Growth Hub – Our Services – Femade Group — Femade Group – Femadec Group: Driving Innovation in Clean Energy Solutions – Nigeria Renewable Energy Market & Power Sector Insights | Powerelec 2027 — powerelecnigeria.com – U.S. Energy Information Administration – EIA – Independent Statistics and Analysis — eia.gov – Outage Statistics – Niagara-on-the-Lake Hydro Inc. — Niagara-on-the-Lake Hydro Inc. – Nigeria: Clean energy for rural electrification – atmosfair — atmosfair – Nigeria raised electricity prices to improve supply. Why it hasn’t worked — The Conversation – #homey #energy #energytransition | Stefan Witkamp — LinkedIn – Electricity sector in Nigeria – Wikipedia — en.wikipedia.org